Resselgasse 3/188, A-1040 Wien, Austria
www.ifs.tuwien.ac.at/
Andreas Rauber, Dieter Merkl
Institut für Softwaretechnik, Technische Universität Wien
Resselgasse 3/188, A-1040 Wien, Austria
www.ifs.tuwien.ac.at/![]() andi www.ifs.tuwien.ac.at/
andi www.ifs.tuwien.ac.at/![]() dieter
dieter
Keywords: Self-Organizing Map (SOM), Document Clustering, Learning, Distributed Digital Libraries, Dublin Core Metadata, Metaphor Graphics, Visualization,
During the last years we have witnessed an uninterrupted rise of the amount of information available in electronic form. While the size and availability of electronic information has changed a lot, ways for representing and interacting with those collections could not keep pace. Most information repositories still present themselves as varieties of lists of entries, ranging from filename listings and commented lists of documents to manually created hierarchies of pieces of information, which usually try to find one single place for every document in the collection. Searching these collections requires users to define their queries in some boolean logic based expressions, specifying large numbers of keywords, synonyms and antinyms, requiring both knowledge of the problem domain as well as basic query formulation experience. Results of queries are usually presented as long lists of (both relevant and irrelevant) retrieved documents sorted following some ranking criteria, with the large overall number of documents retrieved usually inhibiting efficient search. Information on the documents retrieved from a collection is at the most presented as a rather long textual description of the available metadata.
On the other hand, taking a look at conventional libraries (which have a long history and thus had time to evolve and adapt to our needs) and the way we approach and query them, we find a completely different situation: Libraries usually exhibit a clearly detectable structure by organizing books by topic into sections and shelves. This structure allows us to gain insight into the contents of the library as well as to get a rough overview of the amount of information available on specific topics. When entering a library or large-scale book store, in spite of the overwhelming amount of information present in such locations users usually manage to orient themselves and find the way to their section of interest quite easily. Without being able to read the title of books from the far distance, not knowing actually where to find a book by a specific author or even without knowing a title or an author of a book, most people are able to locate the respective sections when looking for a dictionary, a poem collection or a story book for children. Searching a library can take several forms: you might start browsing from the entrance via different floors to any specific section and shelve, which is then searched entry by entry. Note, that at most libraries you find a map of the library at the entrance, giving an overview of books on which topic may be found in which section. A second approach may be by searching keyword, author and title catalogues. Third, you might also ask a librarian to help you find the requested pieces of information by giving a rough idea of the desired book. The outcome of such an inquiry is usually not only a list of titles or a pile of books, but also includes some recommendations based on the experience of the librarian. Furthermore, locating one book in the library usually leaves you, due to the topical structure, with several other relevant ones nearby. Once you find the corresponding shelve, by scanning the books sorted there, it is usually easy for you to tell the age of a book, the number of times it has been used before (at least in a public library rather than in a bookstore), as well as the amount and type of information to be expected in the books simply by looking at them. The cover of the book, the title, type of binding, the shape of the binding (brand new versus well-thumbed and almost torn apart), the size of the book, color and other properties of an item on the shelve contain a wealth of information that most people are accustomed to and able to interpret intuitively. Thus, it is easy for us to gain an overview of the contents of a library, the type of information present, how many items of a specific title can be found etc. All these features make orientation rather easy in spite of the wealth of information present.
Thus, we find conventional libraries and article collections in some aspects very well suited for the task they are intended to serve, whereas in other aspects digital libraries undoubtly offer more possibilities. Adopting these characteristics of conventional libraries for electronic media to combine the benefits of the evolved structures of conventional systems with the benefits of digital systems has proven to be difficult. This is partially due to the mere amount of information growth. Reading and manually classifying all entries in an information repository to create an order similar to the one found in conventional libraries proves to be a sisyphean struggle, as does searching and browsing these huge collections.
In this paper we present the SOMLib [22] digital library system. It is based on neural networks, especially the self-organizing map (SOM) [13], trying to combine the benefits of conventional library structures and procedures with the enhanced capabilities of digital libraries by topically clustering documents on a 2-dimensional map similar to conventional library organization. We demonstrate the SOMLib library system using the classic TIME Magazine article collection. This setting allows the evaluation of the system in the context of a real world document collection covering diverse topics while being generally intelligible. The collection is split into several subsets to model a series of consecutively released collections. These sets of articles are treated as independent document archives represented by independent self-organizing maps. The SOMs are then integrated into a single map to model the creation of a meta-library [25]. All of these document archives are labeled using the LabelSOM method [26], providing an instant overview of the topics covered in the whole article collection in an organized way. Furthermore, the libViewer [24] is used to serve as a metaphor graphics based interface to the document collection, providing intuitive visualiation of the resources in an information repository by making metadata on the resources instantly intelligible.
The remainder of this paper is organized as follows. We start with a description of the document collection forming the basis for a set of independent libraries in Section 2. Next, the creation of SOMLib maps providing a topically ordered representation of the individual libraries using the self-organizing map is presented in Section 3. The integration of these individual, distributed library maps to form a single information repository is provided in Section 4, followed by the presentation of the LabelSOM method for automatically labeling the various independent maps in Section 5. Finally, the libViewer interface using metaphor graphics for the visualization of the libraries is described in Section 6. We round off the paper by giving an overview on related work in Section 7, ending up with some conclusions in Section 8.
For the experiments presented hereafter we use the classic TIME Magazine article collection![]() .
It consists of a collection of 420 articles from the TIME Magazine dating from the early 1960's.
This collection, while being small enough to be presented in sufficient detail, provides the benefits of a real-world article collection covering a wide range of topics from foreign affairs to high-society gossip, thus forming an ideal testbed for the evaluation of our approach.
To model a distributed library consisting of subsequent releases of a magazine, we split the document collection into 6 parts consisting of the documents T000 - T099, T100 - T199, ..., T500 - T599.
Please note, that the consecutive numbering is not complete, i.e. not all articles are available in the package.
Thus we obtain 6 sets of documents of different size with each set containing between 53 and 87 documents.
.
It consists of a collection of 420 articles from the TIME Magazine dating from the early 1960's.
This collection, while being small enough to be presented in sufficient detail, provides the benefits of a real-world article collection covering a wide range of topics from foreign affairs to high-society gossip, thus forming an ideal testbed for the evaluation of our approach.
To model a distributed library consisting of subsequent releases of a magazine, we split the document collection into 6 parts consisting of the documents T000 - T099, T100 - T199, ..., T500 - T599.
Please note, that the consecutive numbering is not complete, i.e. not all articles are available in the package.
Thus we obtain 6 sets of documents of different size with each set containing between 53 and 87 documents.
|
To be used for map training, a vector-space representation of the single documents is created.
For each document collection a list of all words appearing in the respective collection is extracted while applying some basic word stemming techniques.
Words that do not contribute to contents description are removed from these lists.
Instead of defining language or content specific stop word lists, we rather discard terms that appear in more than 90% or in less than 3 articles in each collection.
Thus, we end up with a vector dimensionality between 1255 and 2019 for the 6 document sets, cf. Table 1.
The individual documents are then represented by feature vectors using a
![]() ,
i.e. term frequency
,
i.e. term frequency ![]() inverse document frequency, weighting scheme [30].
This weighting scheme assigns high values to terms that are 'important' as to describe and discriminate between the documents.
These feature vectors are further used to train 6 self-organizing maps consisting of between 42 and 70 units.
An overview of the experimental setup is provided in Table 1.
inverse document frequency, weighting scheme [30].
This weighting scheme assigns high values to terms that are 'important' as to describe and discriminate between the documents.
These feature vectors are further used to train 6 self-organizing maps consisting of between 42 and 70 units.
An overview of the experimental setup is provided in Table 1.
The SOMLib library is based on the self-organizing map [13] (SOM), one of the most prominent artificial neural network models adhering to the unsupervised learning paradigm.
The model consists of a number of neural processing elements, i.e. units.
Each of the units i is assigned an n-dimensional weight vector mi,
![]() .
It is important to note that the weight vectors have the same dimensionality
as the input patterns.
.
It is important to note that the weight vectors have the same dimensionality
as the input patterns.
The training process of self-organizing maps may be described in terms of input pattern presentation and weight vector adaptation. Each training iteration t starts with the random selection of one input pattern x(t). This input pattern is presented to the self-organizing map and each unit determines its activation. Usually, the Euclidean distance between the weight vector and the input pattern is used to calculate a unit's activation. In this particular case, the unit with the lowest activation is referred to as the winner, c, of the training iteration, as given in Expression (1).
Finally, the weight vector of the winner as well as the weight vectors of selected units in the vicinity of the winner are adapted. This adaptation is implemented as a gradual reduction of the difference between corresponding components of the input pattern and the weight vector, as shown in Expression (2).
Geometrically speaking, the weight vectors of the adapted units are
moved a bit towards the input pattern.
The amount of weight vector movement is guided by a so-called
learning rate, ![]() ,
decreasing in time.
The number of units that are affected by adaptation is determined
by a so-called neighborhood function, hci.
This number of units also decreases in time
such that towards the end of the
training process only the winner is adapted.
Typically, the neighborhood function is a unimodal function which is
symmetric around the location of the winner and monotonically decreasing
with increasing distance from the winner.
A Gaussian may be used to model the neighborhood function as given
in Expression (3) with ri representing
the two-dimensional vector pointing to the location of unit i within
the grid, and
|| rc - ri || denoting the distance
between units c, i.e. the winner of the current training iteration,
and i in terms of the output space.
It is common practice that at the beginning of training a wide area of
the output space is subject to adaptation.
The spatial width of units affected by adaptation is reduced gradually
during the training process.
Such a strategy allows the formation of large clusters at the beginning
and fine-grained input discrimination towards the end of the training
process.
The spatial width of adaptation is guided by means of the time-varying
parameter
,
decreasing in time.
The number of units that are affected by adaptation is determined
by a so-called neighborhood function, hci.
This number of units also decreases in time
such that towards the end of the
training process only the winner is adapted.
Typically, the neighborhood function is a unimodal function which is
symmetric around the location of the winner and monotonically decreasing
with increasing distance from the winner.
A Gaussian may be used to model the neighborhood function as given
in Expression (3) with ri representing
the two-dimensional vector pointing to the location of unit i within
the grid, and
|| rc - ri || denoting the distance
between units c, i.e. the winner of the current training iteration,
and i in terms of the output space.
It is common practice that at the beginning of training a wide area of
the output space is subject to adaptation.
The spatial width of units affected by adaptation is reduced gradually
during the training process.
Such a strategy allows the formation of large clusters at the beginning
and fine-grained input discrimination towards the end of the training
process.
The spatial width of adaptation is guided by means of the time-varying
parameter ![]() .
.
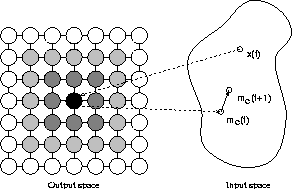
Consider Figure 1 for a graphical representation
of self-organizing maps.
The map consists of a square arrangement of
![]() units,
shown as circles on the left hand side of the figure.
The black circle indicates the unit that was selected as the winner
for the presentation of input pattern x(t).
The weight vector of the winner, mc(t), is moved
towards the input pattern and thus, mc(t+1) is nearer to x(t) than
was mc(t).
Similar, yet less strong, adaptation is performed with a number of units
in the vicinity of the winner.
These units are marked as shaded circles in Figure 1.
The degree of shading corresponds to the strength of adaptation.
Thus, the weight vectors of units shown with a darker shading are moved
closer to x(t) than units shown with a lighter shading.
units,
shown as circles on the left hand side of the figure.
The black circle indicates the unit that was selected as the winner
for the presentation of input pattern x(t).
The weight vector of the winner, mc(t), is moved
towards the input pattern and thus, mc(t+1) is nearer to x(t) than
was mc(t).
Similar, yet less strong, adaptation is performed with a number of units
in the vicinity of the winner.
These units are marked as shaded circles in Figure 1.
The degree of shading corresponds to the strength of adaptation.
Thus, the weight vectors of units shown with a darker shading are moved
closer to x(t) than units shown with a lighter shading.
The SOM has been used repeatedly for the unsupervised classification of free-form text documents, cf. [12,16,17,28]. Text documents can be thought of topical clusters in the high-dimensional feature space spanned by the individual words in the documents. A trained SOM thus represents a topical ordering of the documents, meaning that documents on similar topics are located close to each other on the 2-dimensional map. This is comparable to what one can expect from a conventional library, where we also find the various books ordered by some contents-based criteria. Thus, the SOM offers by its very architecture an ideal way for the organization of document repositories.
The items to be included in the SOMLib library system are represented in the form of feature vectors, which are created by parsing the texts and processing the resulting word histograms to provide a compact representation of the texts. These feature vectors are used as input to train a standard self-organizing map. By determining the size of the map the user can decide which level of abstraction she desires. The larger the maps, the more units are available for representing the various topics in the document archive, while a smaller SOM produces a less detailed representation of the collection.
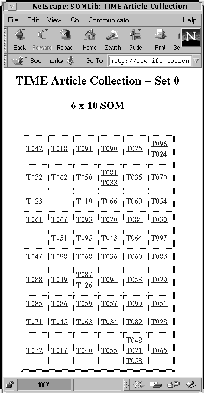
Figure 2 presents the first of the 6 SOMs trained with the subsets of the TIME Magazine articles. The units are represented by the squares in the map, with the articles mapped onto a unit being listed in the unit area. By taking a closer look at the individual documents mapped onto identical or neighboring units we find, that the SOM has succeeded in producing a topically ordered representation of the articles similar to how a human being would arrange the articles in shelves with articles on similar topics being located close to each other.
For example, on unit (0/0)![]() we find article T042 entitled The View from Lenin Hills dealing with a discussion between Nikita Khrushchev and Soviet artists at the Lenin Hill Reception Palace, next to article T018 - Who's in Charge Here? about the failure of Khrushchev's virgin land plan for agriculture on unit (1/0) or T032 - Party Time on unit (0/1) on the New Year's Eve party at the Kremlin.
On the opposite corner of the map on unit (5/9) we find documents dealing with the problems of the reintegration of Kolwezi into the Congo discussed at a meeting between officials in article T065 - Tea and Harmony, next to three articles on unit (4/9) (T021, T048, T058 entitled The India-Rubber Man; Round 3; and Tshombe's Twilight), providing more detailed information on the background of the Congo troubles.
Other groups of documents found on this map deal, for example, with the war in Vietnam, the relation between India, Pakistan and China etc.
We leave it up to the reader to explore the other topical sections found in this and the remaining library maps
we find article T042 entitled The View from Lenin Hills dealing with a discussion between Nikita Khrushchev and Soviet artists at the Lenin Hill Reception Palace, next to article T018 - Who's in Charge Here? about the failure of Khrushchev's virgin land plan for agriculture on unit (1/0) or T032 - Party Time on unit (0/1) on the New Year's Eve party at the Kremlin.
On the opposite corner of the map on unit (5/9) we find documents dealing with the problems of the reintegration of Kolwezi into the Congo discussed at a meeting between officials in article T065 - Tea and Harmony, next to three articles on unit (4/9) (T021, T048, T058 entitled The India-Rubber Man; Round 3; and Tshombe's Twilight), providing more detailed information on the background of the Congo troubles.
Other groups of documents found on this map deal, for example, with the war in Vietnam, the relation between India, Pakistan and China etc.
We leave it up to the reader to explore the other topical sections found in this and the remaining library maps![]() .
Obviously, the resulting representation, while nicely organizing the documents by topic, does not facilitate understanding the document archive by solely listing the document numbers.
This would not change a lot if we chose to use the headlines of the articles as labels instead of document numbers.
We refer the reader to Section 5 for a more intuitive representation of the topical sections based on automatically created labels.
.
Obviously, the resulting representation, while nicely organizing the documents by topic, does not facilitate understanding the document archive by solely listing the document numbers.
This would not change a lot if we chose to use the headlines of the articles as labels instead of document numbers.
We refer the reader to Section 5 for a more intuitive representation of the topical sections based on automatically created labels.
The clustering capabilities of the SOM, apart from providing a nicely organized representation of a document archive, greatly facilitate interactive information retrieval and browsing. A query is treated like a document, parsed to create a feature vector representation and presented to the map, retrieving the documents mapped onto the winning unit. Starting from this point the user finds similar documents on related topics on the neighboring units, allowing an interactive exploration of the document archive. If large numbers of documents are retrieved, they can be parsed to create a smaller SOM, structuring those documents at a finer granularity.
One of the benefits of a digital library system is, that documents need not be assigned a single location. While all articles in the presented application are currently assigned to exactly one unit, this is not a requirement of the system. Rather, we want articles covering more than one single topic to be assigned to multiple units. This can be easily achieved by not creating one feature vector description per document but rather creating one feature vector per section of a document allowing multiple assignments of documents to units.
Please note, that the units of a map do not solely represent the number of documents mapped onto them during the training process. Rather, the weight vector of a unit serves as a representative for a topic within the repository. Thus, new documents being added to the library can be mapped onto an existing SOM, much like new books can be added to a library bookshelf, while out-of-date documents can be removed from the map. The representation of topics rather than library items supports the much more fluid nature of digital collections as opposed to the rather static, conserving conventional libraries. A trained SOM thus can serve as a repository for a newspaper, with the daily articles being mapped onto the appropriate sections of the map similar to conventional newspaper organization. If new topics emerge, this results in a higher mapping error, because the SOM is not able to find a unit representing the new topics appropriately. In this case, either a new SOM can be trained to represent these emerging new topics using the documents that could not be mapped well enough, or one of the incrementally growing variations of the SOM may be used [5].
The training process of a SOM assumes, that all data for training is available locally. This assumption is not generally true, especially in the arena of digital libraries, which generally do not exist as static collections of text in one central location. Rather, we find the text collections distributed over several sites, often being highly specialized in certain topics, which we want to combine and acces via one central location. Furthermore, especially in the case of periodicals, we find small collections of documents being added to the library at intervals, with each edition of a journal or each annual collection possibly being represented by a small library SOM. What we want to have is a way to integrate those distributed libraries into a kind of higher-level library without having to transfer all data to a central location to produce the training data for the SOM and without having to train the whole map again.
The SOMLib system allows the integration of those distributed collections by using the weight vectors of the various SOMs as input to train a higher-level SOM [19,22,25].
Since the weight vector structures of the independently trained SOMs differ, i.e. contain different content terms as identified during the document parsing process, they are merged to form a weight vector representation containing all content terms of the individual collections, which, in our example, leads to a new feature space of 3303 content terms.
Instead of using the feature vectors of the 420 articles as input for the SOM representing the complete document collection, we use the weight vectors of the units in the individual SOMs representing the topics present in the various collections.
This results in the integrating
![]() SOM being trained with 359 input vectors of dimensionality 3303, forming a topologically ordered mapping of the topical sections of the individual library maps.
SOM being trained with 359 input vectors of dimensionality 3303, forming a topologically ordered mapping of the topical sections of the individual library maps.
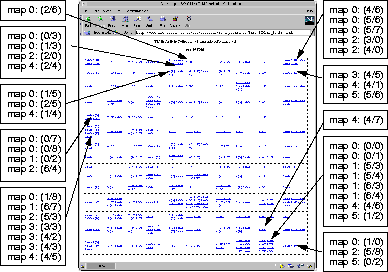
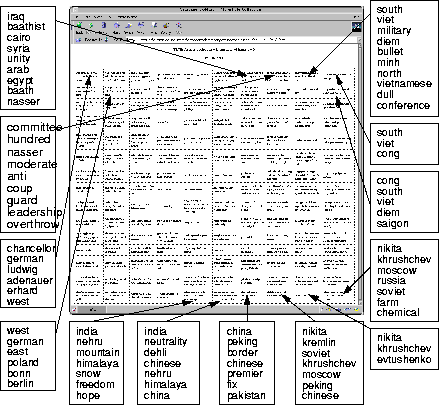
The integrating SOM given in Figure 3, instead of representing the document vectors on its units, lists the units of the 6 individual SOMs, which in turn represent the corresponding articles. Again, we find the topology preserving mapping capabilities of the SOM as in the previous example which was trained directly using the document description vectors. We now find the units describing the documents T042, T032, T018 on the Soviet Union, previously located in the upper left corner of map 0 (presented in Figure 2) mapped onto units (8/14) and (9/14) of the integrating map. Taking a look at the articles mapped onto these units we find, that they all cover topics related to the Soviet Union. For unit (9/14) these are articles T229 - Russia: A Senior Citizen, T542 - Russia: Better Things for Better Living through Chemistry; T539 - Russia: Something for the Soil. Mapped on unit (8/14) we find 8 units from 4 different maps representing a total of 9 documents all dealing with the Soviet Union, surrounded by further units representing units and thus articles on this topic. Other document clusters identified on the individual maps can be found like, e.g. the cluster on the Vietnam war in the lower right corner of the map. For a more detailed and intuitive representation of the topical clusters found in the map, please refer to Section 5 presenting the LabelSOM method.
As the size of a SOM greatly influences the granularity of the archive representation, each map can be optimized, representing the articles at the desired level of abstraction. These maps can then be integrated to form the higher-level library, greatly reducing training times by using a smaller number of weight vectors as input instead of all the document feature vectors. Still, the quality of the resulting integrating map is comparable to a map trained directly with the feature vectors of the documents [19]. However, not only whole SOMs, but also parts of a SOM down to individual units can be integrated that way. This facilitates the creation of personal libraries by allowing every user to choose, which sections of a library she wants to integrate, using only those weight vectors of a SOM library as input to her personal SOM. For example, a user may choose to create a personal library covering only articles related to the war in Vietnam. Thus she can choose to train her personal library SOM using only the weight vectors of those units on the individual maps that represent this topic. This makes any articles mapped onto the respective maps later on instantly accessible on her personal library map. Queries presented to the SOM are passed only to those units of maps represented by the winning unit, retrieving articles from the appropriate locations instead of processing the query at all maps.
As we have seen, the SOM offers itself to the representation of document archives by organizing the documents according to their contents. However, the contents of the various areas on the map is not visible as such. What we want to have is - similar to conventional libraries - a kind of guide map to the repository, where the individual sections are being labeled with keywords.
Present SOMs for document archive representation mostly are labeled manually, i.e. the documents on a particular unit are read and based on the topics found on the respective unit a set of keywords is assigned, similar to the way the results were described in this paper so far. However, manually assigning labels is highly labour intensive by requiring manual inspection of all data items mapped onto the units. What is needed, is a way to automatically label the units and clusters of a SOM to make the structures learned by the map explicit, i.e. to give a justification for a particular mapping.
The LabelSOM method [23,26] developed in the course of the SOMLib project allows to automatically describe the categories of documents by extracting the features learned by the SOM and thus assists the user in understanding the data collection presented by the map. It is built on the observation, that the weight vectors of a trained SOM serve as prototypes of a set of input signals, i.e. they exhibit the features of the articles mapped onto a particular unit. Thus we can assume that those features (i.e. content terms), that are shared by a majority of documents mapped onto a particular unit, serve as a description for the respective unit. The LabelSOM method finds those features that are highly similar for all input signals mapped onto a particular unit and thus best serve as a label for it. The selection of features is based on the quantization error vector which stores the quantization error for each feature at a unit by determining the summed Euclidean distances for all input signals mapped onto that particular unit. Features exhibiting a low quantization error can then be chosen as the most likely candidates for labeling the respective unit.
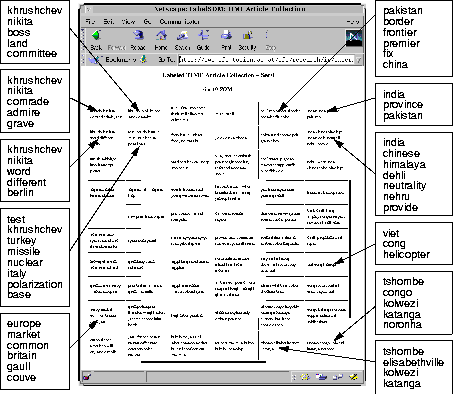
Figure 4 gives the labels selected by the LabelSOM method for the map depicted in Figure 2.
Due to space considerations we can only present the labels for a subset of all units.
However, the quality of the other labels is quite similar![]() .
�Taking again a look at the units of Figure 2 discussed before, we find unit (0/0) and neighboring units, located in the cluster of articles on the Soviet Union, labeled with, amongst others, khrushchev and nikita.
The rest of the labels give more detailed information on the documents on the respective units, e.g. boss, land, committee on unit (1/0).
For the second cluster discussed before, we find in the lower right corner unit (4/9) labeled kolwezi, katanga, tshombe, elisabethville, naming the locations and key players of the 3 articles on this unit.
.
�Taking again a look at the units of Figure 2 discussed before, we find unit (0/0) and neighboring units, located in the cluster of articles on the Soviet Union, labeled with, amongst others, khrushchev and nikita.
The rest of the labels give more detailed information on the documents on the respective units, e.g. boss, land, committee on unit (1/0).
For the second cluster discussed before, we find in the lower right corner unit (4/9) labeled kolwezi, katanga, tshombe, elisabethville, naming the locations and key players of the 3 articles on this unit.
For the integrating map given in Figure 3 representing all documents in the collection based on the distributed maps, the labels are of similar quality, as depicted in Figure 5.
In the lower right corner we find a group of units sharing labels like nikita, khrushchev, moscow, russia, clearly characterizing the Soviet Union article cluster identified before.
Each unit has more detailed labels like farm, chemical on unit (9/14) or peking, chinese on unit (7/14) dealing with Russian-Chinese relationships.
This marks the overlap of two clusters of documents, namely a Soviet Union cluster and a cluster with articles on China-related matters located right next to it.
This arrangement of articles is typical for the topical mapping of the SOM.
We again leave it to the reader to guess the subject matters of the documents represented by the remaining units.
While the spatial organization of documents on the 2-dimensional map in combination with the automatically extracted concept labels supports orientation in and understanding of an unknown document repository, much information on the documents cannot be told from the resulting representation.
Information like the size of the underlying document, its type, the date it was created, when it was accessed for the last time and how often it has been accessed at all, its language etc. is not provided.
Since this information provides valuable guidance in interactive searching and exploration, methods need to be found to convey this information to the user in an intuitive way, refraining from the widely used method of simply listing this metadata as textual descriptions of the documents.
Rather, we want to use well-known metaphors for the representation of the properties of a document.
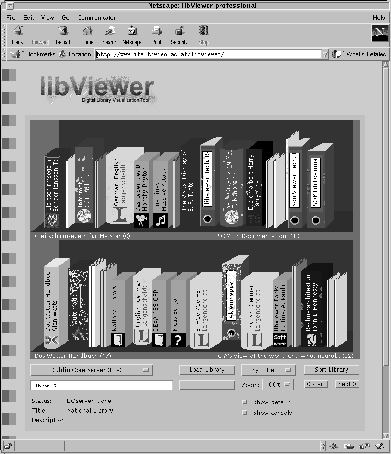
Thus, we are currently developing the libViewer![]() , which
is a User Interface to a digital library.
It is implemented as a Java-Applet allowing the simple representation of and interaction with document archives via the World Wide Web.
, which
is a User Interface to a digital library.
It is implemented as a Java-Applet allowing the simple representation of and interaction with document archives via the World Wide Web.
A set of metaphors is implemented to allow a flexible mapping of metadata attributes to graphical representations in order to best suit the requirements of the user as well as the resources present in the library. A number of mappings can be defined to optimize the representation for the requirements of a digital library, ranging from a rather realistic representation of the items in the library to a more abstract one designed for special exploration purposes. We have currently realized the following metaphors in the libViewer interface:
Based on these metaphors we can define a set of mappings of metadata attributes to be visualized, allowing the easy understanding of documents, similar to the usage of Chernoff faces for multidimensional space representation [7]. However, care must be taken in the selection and definition of these multifunctional elements, so that the encodings can be broken by every user, avoiding the creation of graphical puzzles [32].
Figure 6 provides a sample representation of a digital library containing a number of books, technical reports, papers and multimedia resources as well as hypertext links. Please note, that, for this example we chose to use a different document collection than in the previous sections in order to be able to demonstrate a variety of capabilities of the libViewer interface. However, the mapping of attributes is flexible and can be arranged to suit a given document collection and application domain, with more details on this topic being provided at the end of this section. The various document types can be easily identified, like, e.g. the libViewer and somViewer technical reports in green binders, the 4 different Langenscheidt dictionaries as yellow hardcover books or various paperback books published by e.g. Springer. They are created by assigning each resource type a corresponding document type representation. In the given example, both journal papers as well as conference papers are mapped onto the paper representation metaphor. The difference between conference and journal papers is indicated by their color with the latter appearing in a darker color than the white conference papers. Thus, the hierarchy of document types defined in the Dublin Core metadata can be mapped onto a hierarchy of metaphorical representations.
Further attributes are mapped in a similar fashion, e.g. having the logo identify the publisher of a book if a corresponding logo is available (e.g. Springer, Langenscheidt, Vieweg), or having the thickness of the binding represent the size of the underlying resource as for the different Langenscheidt Dictionaries. Another straight-forward mapping is provided by the degree to which dust has accumulated on the back of the books, ranging from a few dust particles to a spider-web covering half of a book that has not been referenced for a long time, as it is the case for the second book in the lower shelve. On the other hand, the last book in the lower shelve is clearly identified as being frequently referenced due to its rather distorted, well-thumbed binding indicating its frequent use.
Please note, that, although possible, it is not the goal of this system to represent a library as realistically as possible in terms of making all books look as similar as possible to their real-world counterparts. Rather, we want to create a metaphorical representation which is optimized for exploration and intuitive understanding of document collections or search results. These mappings can differ for the specific information and exploration needs as well as for different information repositories. Thus, the mapping described in this example is just one out of many that are possible. For a different collection we might want to map the language of the documents to the color in the representation to clearly identify foreign language books. Another possibility would be to assign the colors of books based on their year of publication, making the various entries in e.g. a journal collection or news magazine archive intuitively visible even when they are not sorted by date. The alignment of books may be used to indicate the relevance of an item in the collection towards a query for the representation of search results.
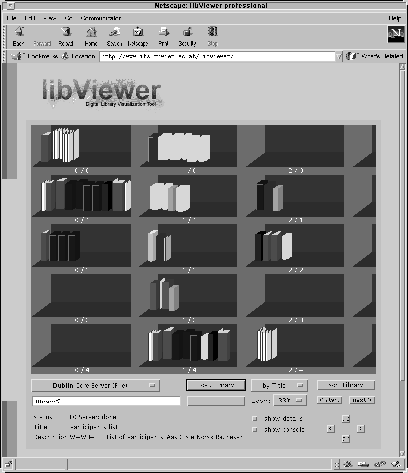
Combining the libViewer interface with the spatial arrangement of documents provided by the SOMLib system results in a set of shelves as depicted in Figure 7, providing an intuitive interface to a digital documents collection. Following the promising initial evaluation of metaphor graphics and the libViewer system with a small group of users we are currently preparing a larger usability evaluation on different document collections including both persons with and without experience in computer and digital library usage.
Document clustering has been identified as one of the key issues in digital library exploration and has thus been addressed in a number of projects like the BEADS system [6] using multidimensional scaling or the BiblioMapper [31] using a hierarchical clustering algorithm. A technique classifying documents in a hierarchical topic structure is presented in [14], the application of the multiple cause mixture model for text categorization using the Reuters document collection is reported in [29]. The self-organizing map and related models have been used in a number of occasions for the classification and representation of document collections. Among the most prominent projects in this arena is the WEBSOM system [12] representing over 1 million Usenet newsgroup articles in a single huge SOM. A variation of this approach using hierarchically organized SOMs is described in [18] using data form the CIA world factbook.
The need for and benefits of integrating distributed collections is especially strong in the field of digital libraries and is thus being addressed in a number of projects concerning the interoperability of and access to distributed systems [3,10,20]. Similar to libraries being interconnected by some organizational network, the combination of several independently managed, possibly highly specialized information repositories is required with the main goal being to define an interface via which these systems can be integrated seamlessly. With the SOMLib system being based on the vector space representation of documents, integration is supported on the level of document representation, allowing the user to build personal libraries of his or her interest. Furthermore, it allows the individual SOMs to stay smaller still providing a high level of detail, with new releases of document collections being integrated at a higher level.
The design of user interfaces allowing the user to understand the contents of a document archive as well as the results of a query plays a key role in many digital library projects and has produced a number of different approaches. [1,2,4,11]. However, most designs rely on the existence of a descriptive title of a document to allow the user to understand the contents of the library, or use manual assignment of keywords to describe the topics of the collection as used in the WEBSOM project, where units were labeled with the newsgroup that a majority of articles on a specific node came from. The LabelSOM method allows now to automatically label the various areas of the library map with keywords describing the topical sections based on the training results. This provides the user with a clear overview of the contents of a SOM library map similar to the maps provided at the entrance to conventional libraries.
The necessity to visualize information and the result of searches in digital libraries has gained increased interest recently. A set of various visualization techniques for information retrieval and information representation purposes was developed at Xerox PARC as part of the Information Visualization Project [27]. Information is depicted in a 3-dimensional space with the focus being on the amount of information being visible at one time and an easily understandable way of moving through large information spaces. As one of the first examples of metaphor graphics for digital library visualization we may consider the Bookhouse project [21], where the concept of a digital library is visualized using the representation of a library building with several rooms containing differing sub-collections and icons representing a variety of search strategies. At the CNAM library, a virtual reality system is being designed for the visualization of the antiquarian Sartiaux Collection [9], where the binding of each book is being scanned and mapped into a virtual 3-dimensional library to allow the user to experience the library as realistically as possible. The Intelligent Digital Library [8] integrates a web-based visual environment for improving user-library interaction. Another graphical, web-based tool for document classification visualization is presented in [15]. While these methods address one or the other aspect of document, library and information space visualization, none of these provides the wealth of information presented by a physical object in a library, be it a hardcover book, a paperback or a video tape, with all the information that can be intuitively told from its very looks. Furthermore, many of the approaches described above require special purpose hardware, limiting their applicability as interfaces to digital libraries. The libViewer provides a flexible way of visualizing information on the documents in a digital library by representing metadata in an intuitively understandable way using standard java technology.
We have presented a digital library system based on the core of a neural network, namely the self-organizing map (SOM). The SOM offers itself by its very architecture for the representation of document archives. Documents are organized on a 2-dimensional map according to their topic. This facilitates both retrieval of documents as well as intuitive interactive browsing by finding documents on similar topics nearby once you are pointed towards a map area by the mapping of the query. Distributed libraries can be integrated, allowing the flexible creation of higher level libraries and personal bookshelves by integrating only subparts of maps of your personal interest. Applying the LabelSOM method automatically assigns keywords to the units of the SOM describing the contents of the various map areas. Thus, the labeled SOM can actually be read and understood as a guide map to the document archive. In the libViewer interface well-known graphical metaphors are used to produce an intuitively understandable representation of the metadata of the documents. This type of information space visualization allows the intuitive and straight forward analysis of large collection of documents, providing an ideal setting for interactive browsing and exploration.
This document was generated using the LaTeX2HTML translator Version 98.1p1 release (March 2nd, 1998)
Copyright © 1993, 1994, 1995, 1996, 1997, Nikos Drakos, Computer Based Learning Unit, University of Leeds.
The command line arguments were:
latex2html -split 0 rau_ecdl99.tex.
The translation was initiated by Andreas RAUBER on 1999-08-24