
Back to: List of Publications
Abstract. In this paper we present the growing hierarchical self-organizing map. This dynamically growing neural network model evolves into a hierarchical structure according to the requirements of the input data during an unsupervised training process. We demonstrate the benefits of this novel neural network model by organizing a real-world document collection according to their similarities.
The self-organizing map (SOM) [3] is an artificial neural network model that proved to be exceptionally successful for data visualization applications where the mapping from an usually very high-dimensional data space into a two-dimensional representation space is required. The remarkable benefit of SOMs in this kind of applications is that the similarity between the input data as measured in the input data space is preserved as faithfully as possible within the representation space. Thus, the similarity of the input data is mirrored to a very large extend in terms of geographical vicinity within the representation space.
However, some difficulties in SOM utilization remained largely untouched even though a large number of research reports on applications of the SOM were presented over the years. First, the SOM uses a fixed network architecture in terms of number and arrangement of neural processing elements which has to be defined prior to training. Obviously, in case of largely unknown input data characteristics it remains far from trivial to determine the network architecture that allows for satisfying results. Thus, it certainly is worth considering neural network models that determine the number and arrangement of units during their unsupervised training process. We refer to [1, 2] for recently proposed models that are based on the SOM, yet allow for adaptation of the network architecture during training.
Second, hierarchical relations between the input data are not mirrored in a straight-forward manner. Such relations are rather shown in the same representation space and are thus hard to identify. Hierarchical relations, however, may be observed in a wide spectrum of application domains, thus their proper identification remains a highly important data mining task that cannot be addressed conveniently within the framework of the SOM. The hierarchical feature map (HFM) as proposed in [9], i.e. a neural network model with hierarchical structure composed from independent SOMs, is capable of representing the hierarchical relations between the input data. In this model, however, the sizes of the various SOMs that build the hierarchy as well as the depth of the hierarchy have to be defined prior to training. Thus, considerable insight into the structure of the input data is necessary to obtain satisfying results.
In order to address both limitations of the SOM within a uniform framework we propose a novel artificial neural network architecture in this paper, the growing hierarchical self-organizing map (GH-SOM). This model uses a hierarchical architecture where SOM-like neural networks with adaptive architecture build the various layers of the hierarchy. The size of these SOM-like neural networks as well as the depth of the hierarchy of the GH-SOM is determined during its unsupervised training process.
The remainder of this paper is organized as follows. In Section 2 we provide an outline of architecture and learning rule of the growing hierarchical self-organizing map. Section 3 contains the description of an application scenario for the growing hierarchical self-organizing map, namely the organization of document archives. Finally, we present our conclusions in Section 4.
2 Growing Hierarchical Self-Organizing Map
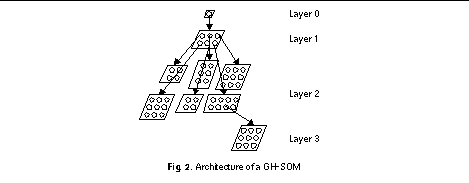
The key idea of the growing hierarchical self-organizing map (GH-SOM) is to use a hierarchical structure of multiple layers where each layer consists of a number of independent self-organizing maps (SOMs). One SOM is used at the first layer of the hierarchy. For every unit in this map a SOM might be added to the next layer of the hierarchy. This principle is repeated with the third and any further layers of the GH-SOM.
Since one of the shortcomings of SOM usage is its fixed network architecture we rather use an incrementally growing version of the SOM. This relieves us from the burden of predefining the network's size which is rather determined during the unsupervised training process. We start with a "virtual" layer 0, which consists of only one single unit. The weight vector of this unit is initialized as the average of all input data. The training process basically starts with a small map of, say, 2 x 2 units in layer 1, which is self-organized according to the standard SOM training algorithm.
Just to summarize the training algorithm, an input pattern is selected randomly and presented to the neural network. Each unit determines its activation according to the distance between its weight vector and the input vector. The unit showing the smallest distance, i.e. the winner, as well as a number of units in the vicinity of the winner are adapted. Adaptation is performed as a gradual reduction of the difference between the vector's components. After the adaptation, the winner will be more similar to the input pattern.
This training process is repeated for a fixed number l of training iterations. Ever after l training iterations the unit with the largest deviation between its weight vector and the input vectors represented by this very unit is selected as the error unit. In between the error unit and its most dissimilar neighbor in terms of the input space either a new row or a new column of units is inserted. The weight vectors of these new units are initialized as the average of their neighbors. This training process is highly similar to the Growing Grid model [2]. The difference so far is that we use a decreasing learning rate and a decreasing neighborhood range instead of fixed values. Especially the fixed neighborhood range is problematic when the network grows to be larger after a series of insertions.
In Fig. 1 we show such an insertion of units. On the left hand side of the figure the situation before the insertion is shown with unit "e" being the error unit and unit "d" being its most dissimilar neighbor. Hence, in such a case a new row of units is inserted between "e" and "d". The inserted units are shown as shaded circles on the right hand side of Fig. 1.

An obvious criterion to guide the training process is the quantization error qi. It is calculated as the sum of the distances between the weight vector of a unit i and the input vectors mapped onto this unit and may be used to evaluate the mapping quality of a SOM based on the mean quantization error (MQE) of all units in the map. The lower the value of the QE, the better the map is trained. A map grows until its MQE is reduced to a certain fraction t1 of the qi of the unit i in the preceding layer of the hierarchy. Thus, the map now represents the data mapped onto the higher layer unit i in more detail.
However, the most important difference to the Growing Grid is the following. Growing Grid is designed to build a single SOM to represent the input data. In case of a large number of input data the resulting map will be large, too. Just to illustrate the point, consider a geographical map of Europe containing all the information that we expect a map of Italy or, even worse, a map of Lombardia should contain. This hypothetical map of Europe will be of a size making it tremendously difficult to find an orientation. Thus, we are rather interested in building small maps where each unit represents a number of input data which are further expanded in separate maps further down the hierarchy.
As outlined above the initial architecture of the GH-SOM consists of one self-organizing map. This architecture is expanded by another layer in case of dissimilar input data being mapped on a particular unit. These units are identified by a rather high quantization error qi which is above a threshold t2. This threshold basically indicates the desired granularity level of data representation as a fraction of the initial quantization error at layer 0. In such a case, a new map will be added to the hierarchy and the input data mapped on the respective higher layer unit are self-organized in this new map, which again grows until its QE is reduced to a fraction t1 of the respective higher layer unit's quantization error qi. Note that this may not necessarily lead to a balanced hierarchy. The depth of the hierarchy will rather reflect the ununiformity which should be expected in real-world data collections.
Depending on the desired fraction t1 of QE reduction we may end up with either a very deep hierarchy with small maps, a flat structure with large maps, or -in the most extreme case- only one large map, which is similar to the Growing Grid. The growth of the hierarchy is terminated when no further units are available for expansion, i.e. all units represent the respective data with a quantization error qi below t2.
Consider Fig. 2 for a graphical representation of a GH-SOM. In particular, the neural network depicted in this figure consists of one unit at layer 0, a SOM of 2 x 3 units in layer 1, six SOMs in layer 2, i.e. one for each unit in the layer 1 map. Note that each of these maps might have a different number and different arrangement of units as shown in the figure. Finally, there is one SOM in layer 3 which was expanded from one of the layer 2 units.
3 An Application: Document Archives
We demonstrate the benefits of using the GH-SOM by using a typical application in the information retrieval area, namely the organization of document archives. In order to allow convenient access, the document archive should be organized such that similar documents are located close to one another. There is already a substantial amount of literature showing the feasibility of the SOM in such an application [4, 5, 6, 7, 8, 10, 11] to name but a few.
For the experiments presented thereafter we use the 1990 edition of the CIA World Factbook (WFB) as a sample document archive. The WFB represents a text collection containing information on countries and regions of the world. The information is split into different categories such as Geography, People, Government, Economy, Communications, and Defense Forces. In total, the 1990 edition of the WFB consists of 245 documents We use full-text indexing to represent the contents of the documents, i.e. meaningful keywords describing the contents are extracted directly from the documents without any manual intervention. During indexing we omitted keywords that appeared in less than 15 documents or more than 196 documents. 959 keywords remained for document representation. These keywords are further weighted according to a tf x idf weighting scheme, i.e. term frequency times inverse document frequency, which is a state-of-the-art weighting scheme [12]. The resulting keyword vectors are used for GH-SOM training.
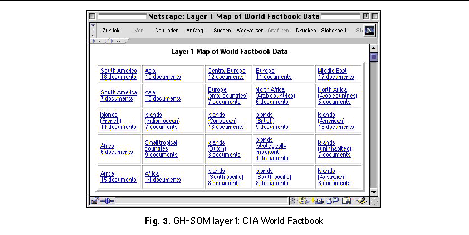
Given the description of the various countries according to the features as outlined above, the GH-SOM produces a rather intuitively interpretable mapping. The first layer map consists of 5 x 5 units and shows already detailed clusters of countries. For example, a cluster with predominantly Latin American countries is located in the upper left corner, African countries are collected in the lower left part of the map. Additional clusters are built by European countries, which are further decomposed into small countries and countries belonging to the communist hemisphere. The first layer of the GH-SOM is shown in Fig. 3.
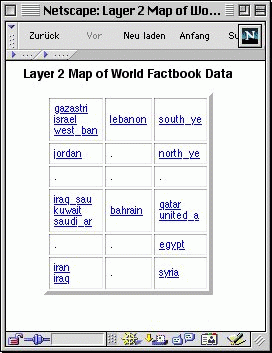
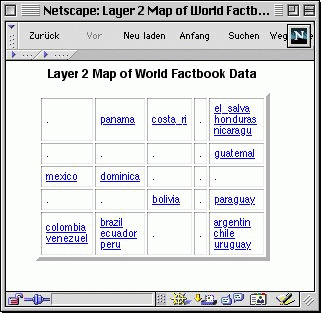
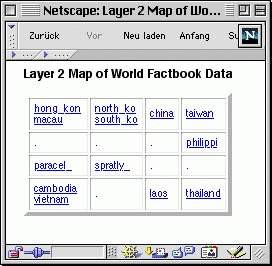
Obviously, it is impossible to show the complete GH-SOM given the limited space in this paper. We can only present some of the other maps in this work in Fig. 4. This figure contains the map representing countries of the Middle East in Fig. 4 (a). Please note that the oil exporting countries are mapped onto neighboring units. Fig. 4(b) shows one of the maps with Latin American countries. For example, the countries Argentina, Chile, and Uruguay, all of which are located in the southern part of South America and show dominant economic ties, are represented by the same unit in the lower right corner. This unit is clearly separated from Middle American countries such as El Salvador, Nicaragua, and Honduras, represented by a single unit in the upper right corner. As another cluster in this map we refer to the tropical countries Brazil, Ecuador, Peru, Columbia, and Venezuela, located in the lower left part of the map. Finally, a map with South-East Asian countries is shown in Fig. 4(c). The other maps as well as the various country descriptions are available for convenient exploration via our web server 1 .
Finally, we should note that the GH-SOM was not intended to produce a clustering of countries based on their geographical location However, surprisingly, the description of the countries' environmental, political, and economic situation has lead to a more or less geographically correct mapping. On a closer look, this result turns out to be quite intuitive considering the fact that countries in neighboring geographical locations quite commonly are also similar in terms of their climate, their economic situation, and their political system.
In this paper we have presented a novel neural network model, i.e. the growing hierarchical self-organizing map. The major features of this model are its hierarchical architecture, where the depth of the hierarchy is determined during an unsupervised training process. Each layer in the hierarchy consists of a number of independent self-organizing maps which determine their size and arrangement of units also during the unsupervised training process. Thus, this model is especially well suited for applications which require hierarchical clustering of the input data. We have shown the usefulness of this model by using an application scenario from the information retrieval area, namely the organization of document archives.
[1] J. Blackmore and R. Miikkulainen. Incremental grid growing: Encoding high-dimensional structure into a two-dimensional feature map. In Proc IEEE Int'l Conf Neural Networks (ICNN'93), 1993.
[2] B. Fritzke. Growing grid: A self-organizing network with constant neighborhood range and adaptation strength. Neural Processing Letters, 2(5), 1995.
[3] T. Kohonen. Self-organized formation of topologically correct feature maps. Biological Cybernetics, 43, 1982.
[4] T. Kohonen. Self-organization of very large document collections: State of the art. In Proc Int'l Conf Artificial Neural Networks (ICANN'98), 1998.
[5] K. Lagus, T. Honkela, S. Kaski, and T. Kohonen. Self-organizing maps of document collections: A new approach to interactive exploration. In Proc Int'l Conf Knowledge Discovery and Data Mining (KDD'96), 1996.
[6] X. Lin, D. Soergel, and G. Marchionini. A self-organizing semantic map for information retrieval. In Proc ACM SIGIR Int'l Conf R&D in Information Retrieval (SIGIR'91), 1991.
[7] D. Merkl. Structuring software for reuse: The case of self-organizing maps. In Proc Int'l Joint Conference Neural Networks (IJCNN'93), 1993.
[8] D. Merkl. Text classification with self-organizing maps: Some lessons learned. Neurocomputing, 21(1-3), 1998.
[9] R. Miikkulainen. Script recognition with hierarchical feature maps. Connection Science, 2, 1990.
[10] A. Rauber. LabelSOM: On the labeling of self-organizing maps. In Proc Int'l Joint Conf Neural Networks (IJCNN'99), 1999.
[11] D. Roussinov and M. Ramsey. Information forage through adaptive visualization. In Proc ACM Conf Digital Libraries (DL'98), 1998.
[12] I. H. Witten, A. Moffat, and T. C. Bell. Managing Gigabytes: Compressing and Indexing Documents and Images. Morgan Kaufmann, 1999.